
Correlation and regression are statistical methods that describe the nature and strength of the relationship between two continuous quantitative variables. The possible scenarios for applying the analyses are innumerable. This article aims to explain when either method should be used, giving an everyday example.
The choice of the method, correlation vs regression analysis, depends primarily on the objectives of the study.
Application of Correlation Analysis
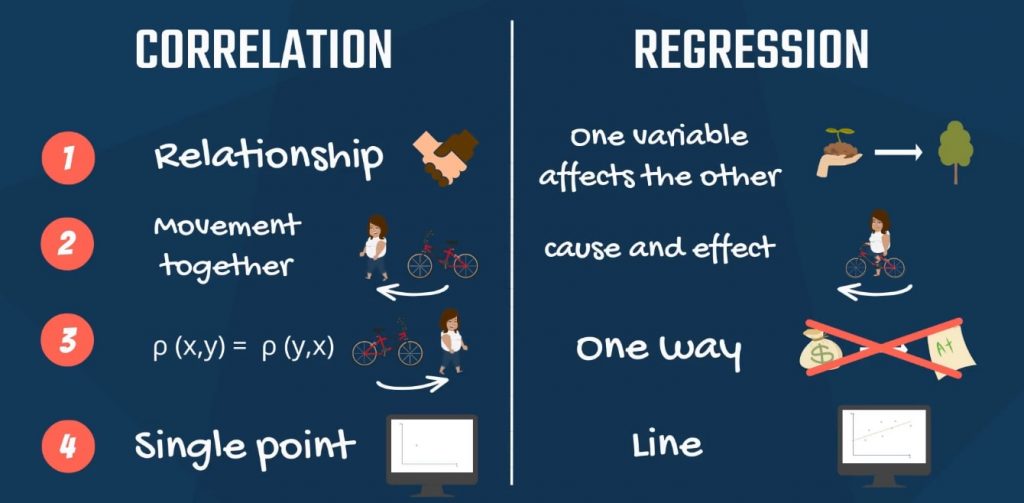
Basically, correlation analysis is a test for an association between two variables, X and Y. It may also prove a cause-and-effect relationship if variation in X causes variation in Y (or vice versa).
For example, organizers of conferences and other events may assume that the number of attendees correlates with the attendees’ satisfaction with an event. To prove or disprove this assumption, they need data about:
- attendance in the past several years;
- the levels of overall satisfaction with the conferences, e.g., based on follow-up surveys that organizers regularly collected.
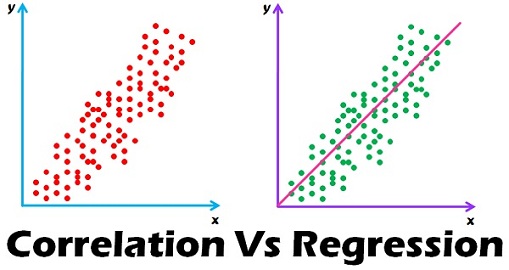
Then, they draw a scatter diagram. Each dot plotted on the chart represents an event. The horizontal positions (X-axis) may indicate the number of attendees, and Y-axis — the respective levels of their satisfaction. The image below shows examples of possible data point distributions.
If the dots are spread randomly, it’s unlikely that attendance and satisfaction are related. A linear distribution pattern may be evidence of a connection. If you can draw a straight line by following the pattern, the correlation between attendance and satisfaction is strong. The inference is that variation in one may cause a change in the other, and vice versa.
Imagine the organizers have established a strong correlation and assume that the more people attend an event, the higher their satisfaction with it.
However, is it the main factor? Can organizers improve the outcomes in the future? Can they foresee the levels of attendee satisfaction based on this or other variables? Yes. It’s time for regression analysis.
Application of Linear Regression
Regression analysis implies that one variable (X) impacts another (Y). The average mathematical relationship between the dependent and independent variables helps estimate the outcome (Y) based on the known value of X. You can determine pretty confidently which factors (independent variables) matter and how much they matter, and even make predictions.
For example, conference organizers may assume that overall attendees’ satisfaction mainly depends on the topics covered, event budget, duration, catering services, registration fees, or other factors. Regression analysis should determine each one’s impact on the outcome. The results should help organizers identify necessary changes so as to satisfy more attendees next time.
Along with information about the attendees’ satisfaction with the events, they need exact data about each event (e.g., budget) or a sufficient set of feedback surveys with questions addressing independent variables. For example, they might be asking participants to evaluate the topics, food, and so on.
The organizers draw another scatter diagram and draw a line through the middle of all of the data points. This is the regression line which represents the relationship, e.g., between an event budget and the attendees’ satisfaction. A standard program like Microsoft Excel can draw it and provide a formula for the slope of the line, e.g., Y = 3 + 4X + error.
There’s an error term because the correlation model is not a precise predictor of dependent variables. For example, a conference budget is important for its success, but there are too many other factors contributing to the attendees’ satisfaction.

Conclusion
The next time a colleague claims that something is impacting the business negatively or positively, suggest performing a correlation analysis to test the hypothesis. Then, regression analysis will show how confident you should be about the relationship. Ideally, the study should help you improve future outcomes by changing one or more determining factors.
The resulting actionable insights can empower business people to make better-informed decisions, allocate resources more efficiently, improve customer satisfaction, and boost sales.